Lab Connections is pleased to announce that, with our guidance and collective efforts alongside lab management we have successfully demonstrated a marked improvement in quality while simultaneously realizing a reduction in operating costs over the period of February 1st to April 30th, 2023. This accomplishment has resulted in a measured cost reduction of $4900 in reagent material over this period. Based on this information, we can extrapolate a projected savings of $19,600 by the beginning of 2024.
In additional to material savings, the lab has realized a labor cost savings as well during this period. This partially due to staffing shortage of one scientist and one assistant, as well as a reduction in the number of traveling contract fees. However, we can also attribute cost savings to reduced efforts by laboratory staff by addressing educational needs and processing events that are more preventable with an improved Quality Control design. It is important to note that while the cost estimations are derived from the time spent on unnecessary operations, the impact on staff morale is difficult to quantify. Nevertheless, this situation allows the staff to allocate their time to perform additional testing profiles and engage in daily laboratory bench activities that can be billed for (instead of merely being lost time). The hospital lab saw a real cost reduction of 27.9% two quarters in a row. This reduction arrives at approximately $48K a quarter.
For the three-month period, we have estimated a labor savings based on a reduction of contracting traveling staff due to stabilization and reduced efforts requiring the scientists to re-run failed quality control events and perform troubleshooting along with unnecessary calibrations.
Labor costs can be classified into two categories: fixed and variable. Estimating the labor cost involved in laboratory testing requires various calculations of the time spent on performing and troubleshooting failed QC events, such as unnecessary calibrations and retesting of QC material. Lab connections has derived a plan to calculate time spent on unbillable hours. This plan was developed through education from the ASCP Laboratory Management University (LMU) courses on financial management and in collaboration with administration at the hospital where the case study was conducted. For more information on the tactics employed contact Lab Connections experts.
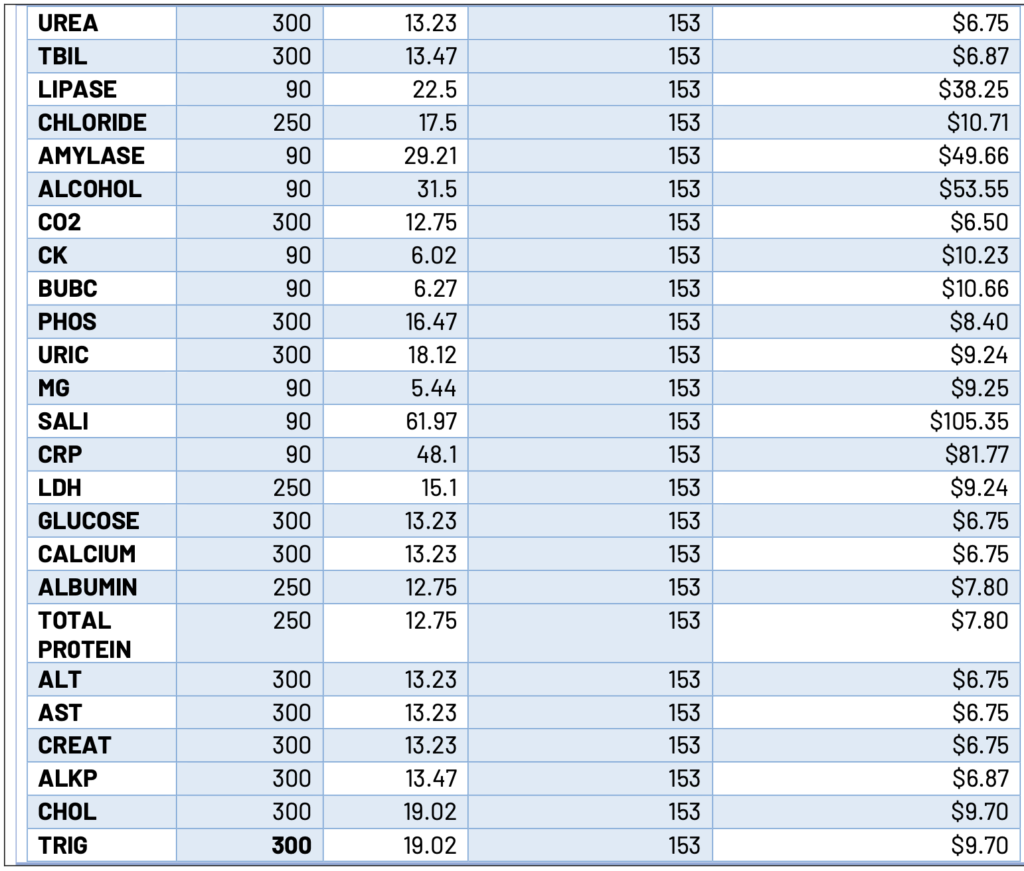
For Microslide test types, we selected 15 test profiles at random. One was removed from the data pool due to being an outlier. We took the remaining 14 profiles and counted the number of QC test events for the previous three months. Through these counts, we can extrapolate an average reduction of 153 unnecessary test events per type. The Quality Control design presented by Lab Connections was able to reduce the Quality Control schedule from 3 testing levels to 2, by assessing patient frequencies. This is responsible for a reduction of 90 of these events. The other ~63 events are due to suboptimal quality control design and improved processes. There are 35 analytes in the current laboratory product profile (for Microslides). If we apply this reduction count of 153 to 35 testing profiles, we end up with an estimated reduction of 5355 unnecessary test events. In June 2023, the labs testing catalog underwent a necessary change where the testing profile for Cerebrospinal fluid was eliminated. As a result, there will be an additional cost reduction of $270 per quarter in regent used strictly for non-billable testing. By collaborating with providers to eliminate unnecessary testing profiles that offer no community benefits and only increase costs, the lab can now focus on exploring more advantageous testing options that cater to both providers and patients.
For the Microtip and Batched Microwell tests, the counts and costs were widely varied, so a manual census (count) was taken of these. QC is not performed on Batched tests daily, so therefore cannot be included in averages. For a clear understanding of the time and cost implications of these, refer to the chart below.
Testing can be categorized into three groups based on assessment principles. Here is a summary breakdown of each category and the corresponding test reductions observed over a period of 3 months.
- Chemistry slides (Microslides) – An average of 14 tests were randomly selected and counted, resulting in a total reduction of 153 tests over the 3-month period.
- Microtip – Due to the significant variability in counts, a manual census was conducted to capture the exact number of tests performed.
- Microwell – An average of 5 tests were randomly chosen and counted, leading to a total estimated reduction of 112 tests over the course of 3 months. Batched tests were performed with a manual census count.


