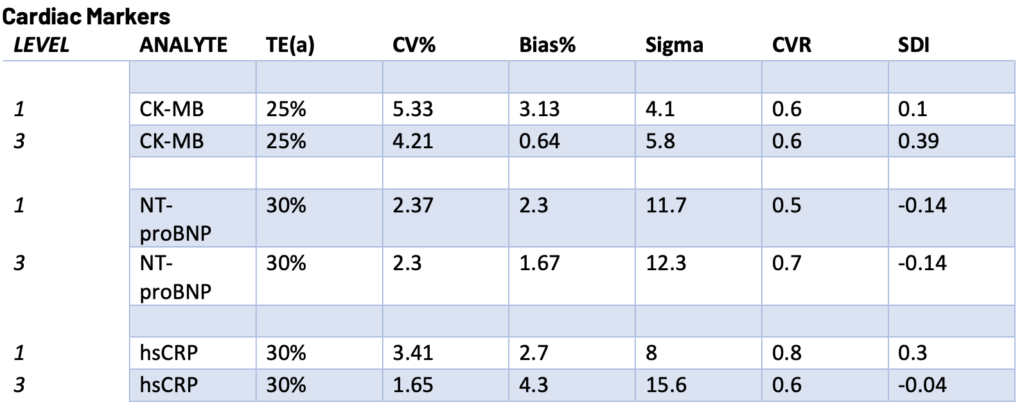
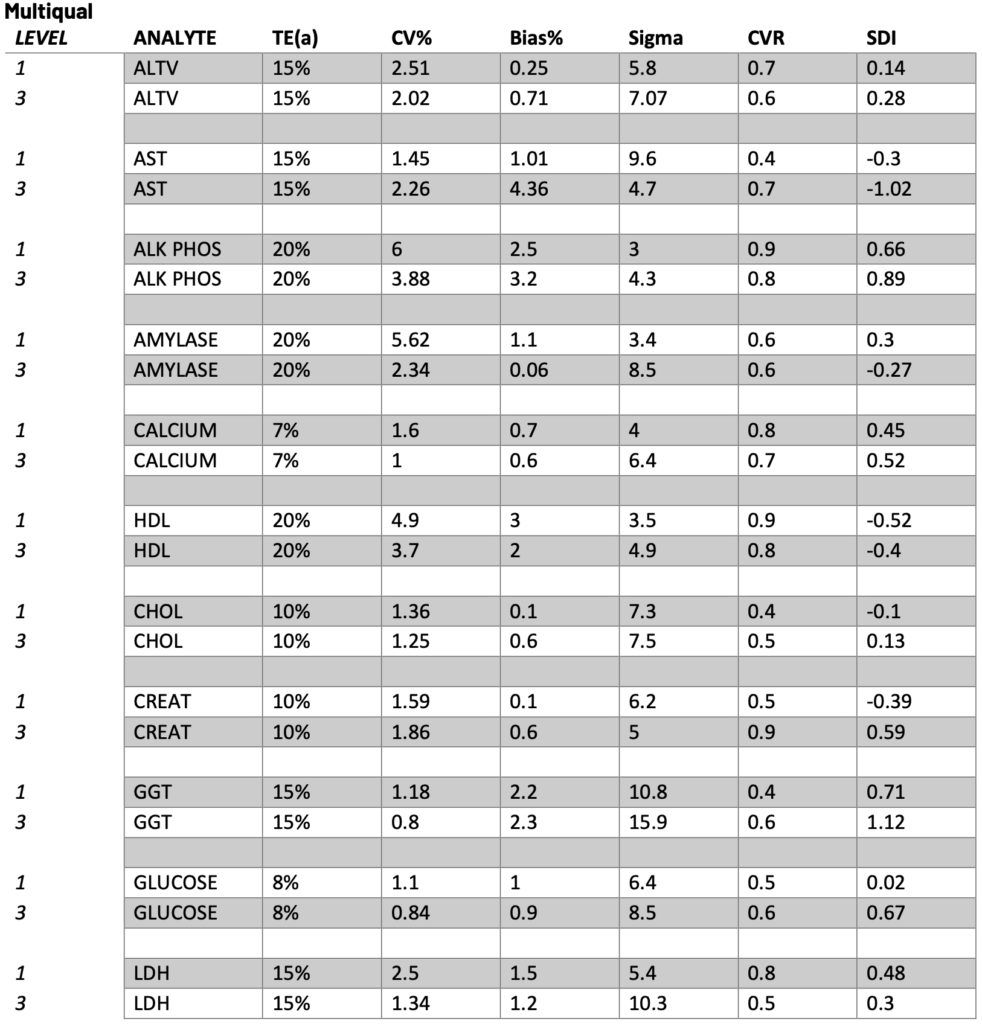
Quality improvements were achieved through collaboration between the Lab Connections team and Laboratory Staff, verifying the accurate transmission of patient results to healthcare providers and fostering staff confidence in delivering precise diagnostic testing. Statistical analysis of the Six Sigma metric, coefficient ratio, and standard deviation index from peer evaluations were employed to measure the progress of quality control initiatives. The data collected demonstrates marked improvement. Additionally, all CAP Surveys, which are laboratory testing audits closely monitored by CLIA inspectors (Health and Human Services), are successfully passing at 100%. In 2022, the hospital lab encountered 20 out of 205 unsatisfactory proficiency testing events across two consecutive audits. Following the recruitment of new staff and contracting Lab Connections team, the proficiency testing (CAP Surveys) events are now achieving a perfect pass rate of 100%.
BioRad, a third-party repository for evaluating quality control results against peer data, publishes monthly quality control reports. In October 2022, the monthly assessment revealed 3 exclusions and 10 warnings, indicating that some quality control events fell below or exceeded acceptable levels. By November 2022, there was a modest improvement, with 2 exclusions and 7 warnings reported. Following the initial 90-day contract with Lab Connections the laboratory staff reached the goal of achieving zero exclusions and zero warnings. Since February 2023, quality control standards have consistently been met at 100%.
Exclusions are reported when the submitted data deviates significantly from the norm and may distort the peer data. Such deviations may result from data entry errors or genuinely poor performance. Conversely, warnings indicate that the data is approaching outlier status, necessitating closer monitoring and potential corrective action. The complexity of evaluating accuracy and precision is explained below:
- Coefficient of Variation (CV) is a measurement of imprecision, it is the ratio of the standard deviation to the mean. This provides a snapshot of variation of testing
- The CVR is a comparison of the lab’s CV and the peer’s CV
- The CVR should be <1.0
- One labs variation should never be higher or equal to 30+ labs cumulative variation
- If the CVR = 1.0 or above, then the lab is not performing well
- Standard Deviation index is a measurement of the lab’s bias or systematic error in
comparison to peer. - An SDI of 0.0 states the lab’s SD and peer’s SD is the same. Optimally the value
reported would <1.0, a value between 1.0 and 2.0 is acceptable but not the ultimate goal. There could be a true systematic error occurring. Further investigation is warranted. A >2.0 results in an exclusion which means there is a serious problem occurring internally. - Six Sigma Values for each test should be at a minimum of 3, higher values represent accuracy and precision. Sigma scores are utilized in conjunction with the average number of results reported to determine the frequency of QC events. Staff, the analyzer and the manufacturer of products all contribute to the stability of testing.
An obstacle with data collection and reporting was discovered by the Lab Connections team. The quality control (QC) data points were not transferring correctly between the analyzer and the software. This interruption resulted in manual entry of QC results. Lab Connections collaborated closely with the Unity (data collection software) technical support team and the hospital’s IT department to address and rectify these issues.
A comprehensive revamp of quality control design and reporting procedures was enacted. Lab Connections conducted personalized one-on-one training sessions with laboratory staff to bolster their knowledge and confidence in evaluating quality control reports. Giving them the assurance that they were correctly analyzing statistical data on a daily, weekly, and monthly basis. Quality control events were spread across all shifts, this practice accomplishes 2 very important objectives:
- All key operators actively participate in quality control events, fostering a sense of collective ownership over data collection within the team.
- This approach alleviates pressure and boosts morale among staff members who may struggle to complete all tasks within a single shift. Lab scientists can experience “Alert Fatigue,” leading to burnout, job dissatisfaction, and costly errors. By dividing tasks among team members, individuals can allocate more time to analyzing the accuracy of patient results in a timely manner. Therefore, contributing to better patient outcomes.
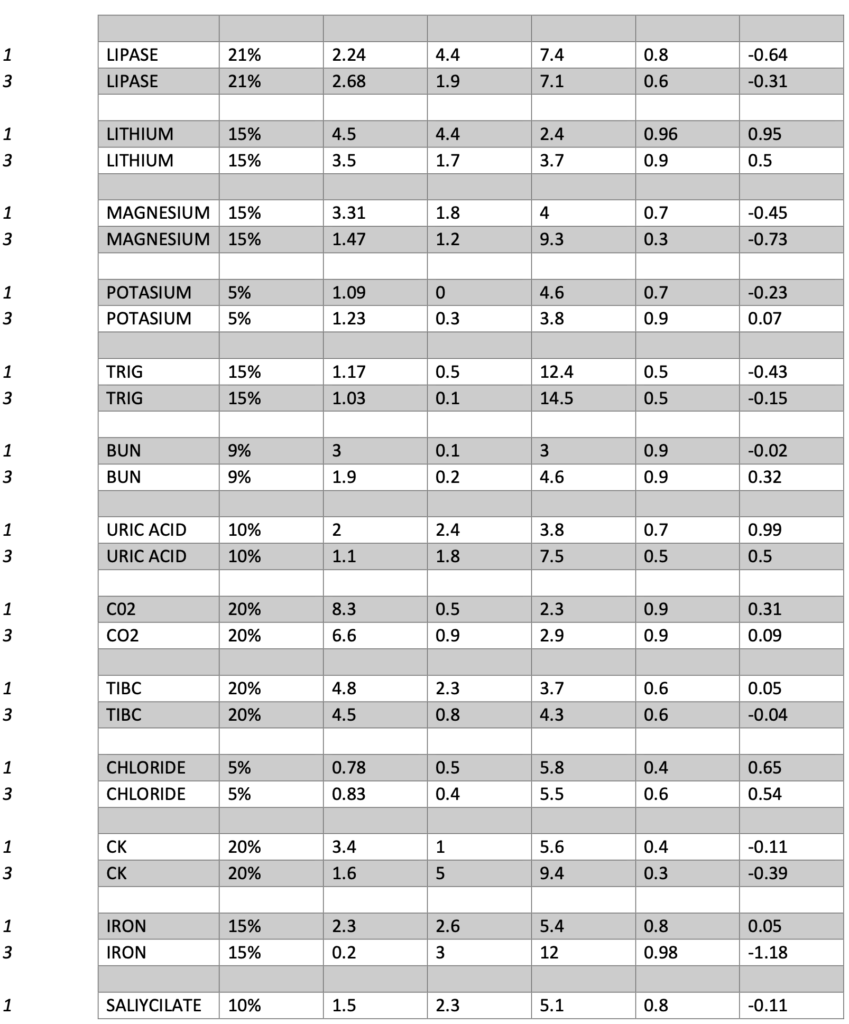
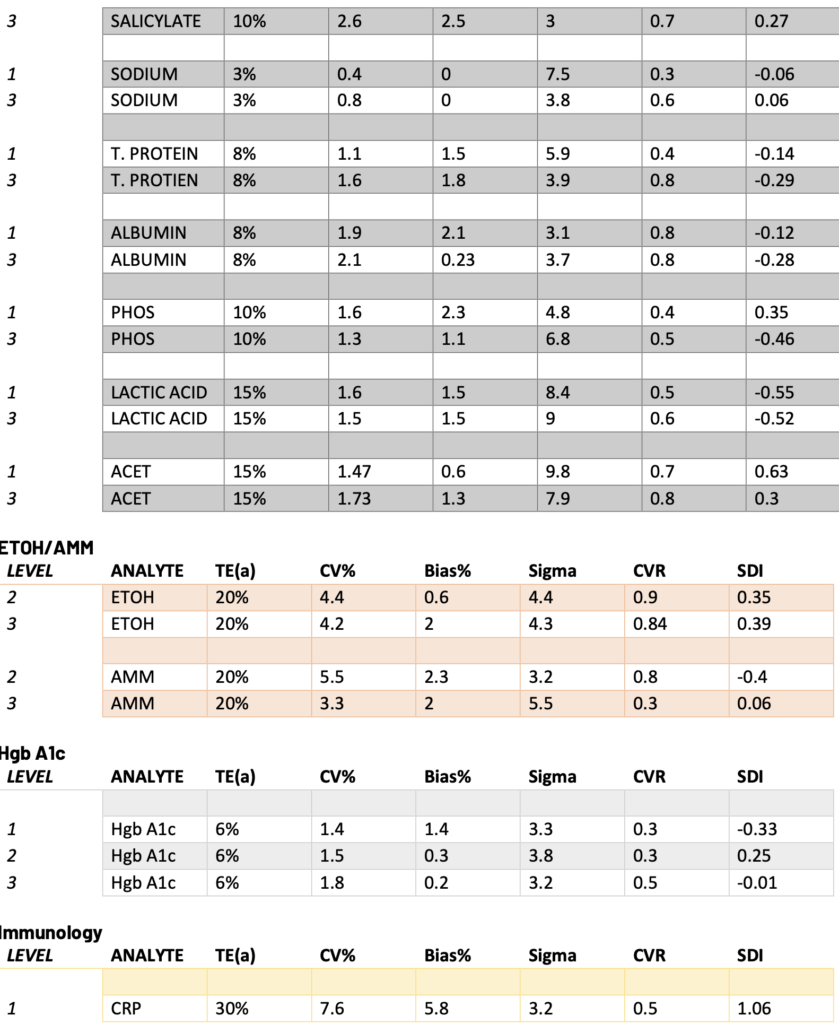
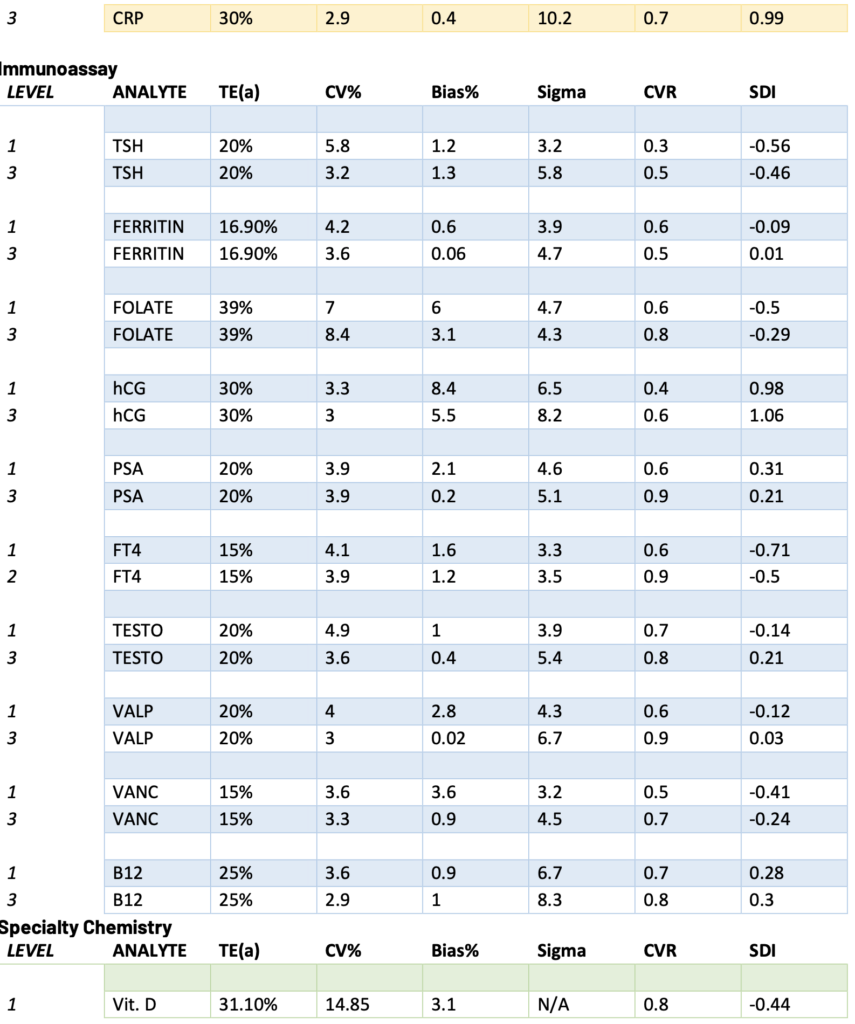
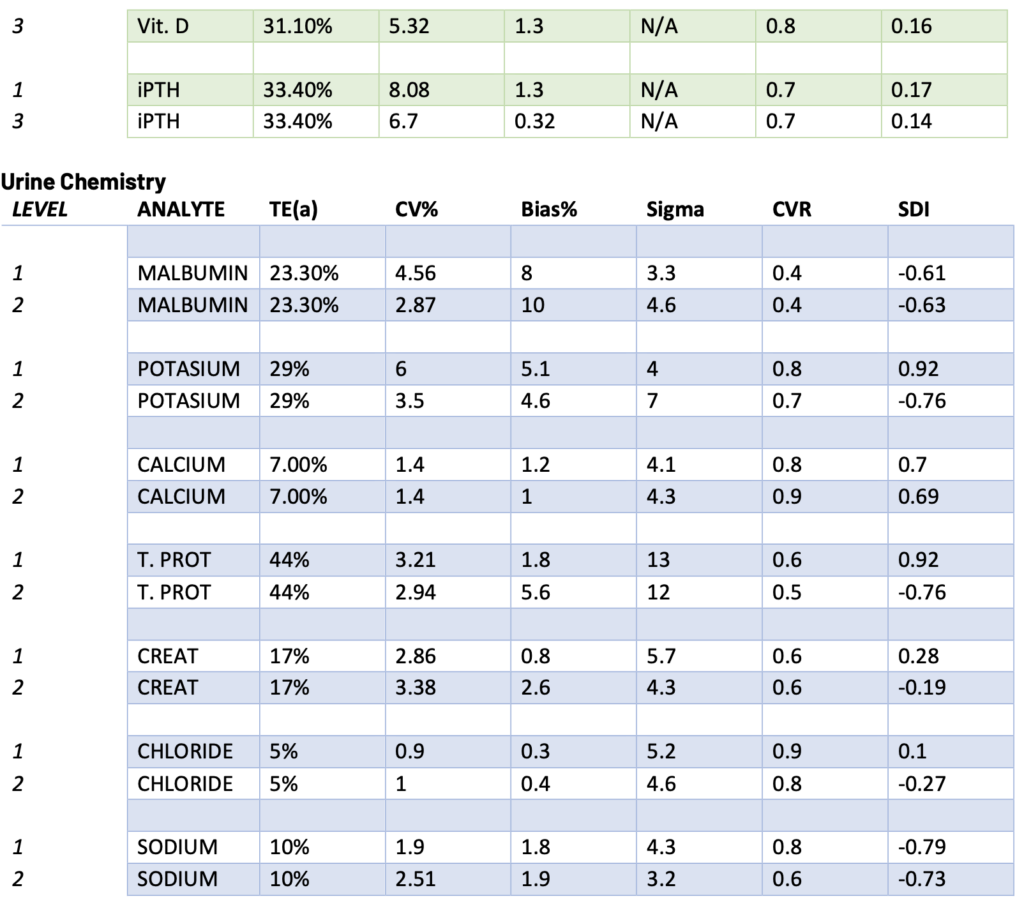
Presented below are the Sigma, CVR, and SDI values for each testing analyte. Notably, Specialty Chemistry Sigma values were omitted due to insufficient data points. A minimum of 100 data points is necessary for a reliable assessment. As this testing is batched, it fails to meet this requirement for proper evaluation. Nevertheless, the CVR and SDI indicate that accuracy and precision are consistently met.
The Sigma values for Lithium and CO2 are notably low. However, the CVR and SDI fall within acceptable parameters, suggesting a potential common precision error across different manufacturing lots. While this discrepancy does not reflect an issue with the precision of the testing itself, it does indicate acceptable variation across lot-to-lot comparisons
